Exploratory Data Analysis (EDA) involves understanding the nature and distribution patterns of your data. While this step doesn’t lead to direct conclusions, it provides insights into the appropriate types of analysis to apply. EDA serves as the essential first step before moving on to inferential analysis.
Data analysis can be classified as-
a) Graphical or non-graphical
b) Univariate or bivariate (mostly) or multivariate
c) Descriptive or inferential
EDA is a quick look over the data and doesn’t include inferential statistics
a) Non-graphical:
– Frequency distribution
– Measures of central tendency and spread
b) Graphical
– Stem-and-Leaf
– Histogram
– Box plot
– Scatter plot
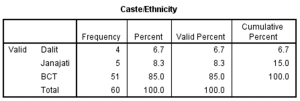
Frequency distribution: Occurrence of particulars observation in the data
– Click on Analyse->Descriptive statistics->Frequency
– Select variable ‘Caste’ and move to ‘Variable box’ by clicking on the arrow OR double click on variable itself
– OK
Central tendency and spread: Gives basic features of the data
– Click on Analyse->Descriptive statistics->Descriptive
– Select variables ‘Foodsufficiency’ and move to ‘Variables’ box by clicking on arrow OR double click on variable itself
– OK

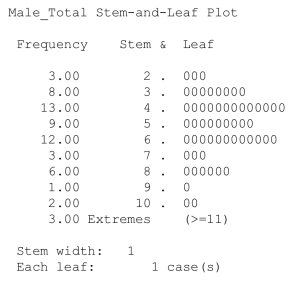
Stem-and-Leaf plot: Displays data in ‘stem’ (ten digit) on the left col and ‘leaf’ on the right col (ones digit).
– Analyze->Descriptive->Explore
– Select variable and put it on the dependent list e.g. Male_Total
– Click on ‘Plot’ button and check on ‘Stem n Leaf’
– OK
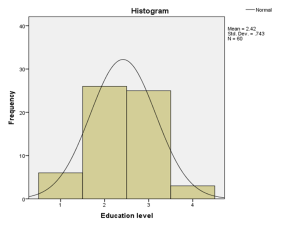
Histogram: Summarizes the distribution of data in pictorial format
– Click on Analyze->Descriptive statistics->Explore
– Select Variables e.g. Education
– Click on ‘Plots’ button and check on ‘Histogram’
– Click on OK
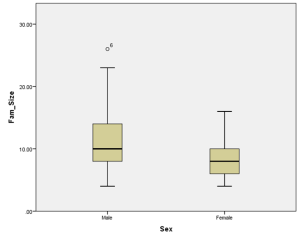
Box plot: Illustrates the location and variation of data
– Click on Graphs->Chart builder
– Select Boxplot from Gallery
– Drag ‘Simple boxplot’ from gallery chart box to ‘Chart preview box’
– Select variables ‘Sex’ for x, and ‘Fam_Size’ for y axis from the list box
– Click on OK
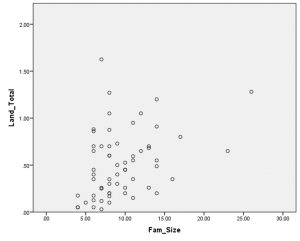
Scatter plot: Presents linear relationship and outliers graphically.
– Click on Graphs->Chart builder
– Select Scatter/Dot from Gallery
– Drag ‘Simple scatter’ from gallery chart box to ‘Chart preview box’
– Select variable ‘Fam_Size’ for x and ‘Land_Total’ for y axis
– Click on OK